By Guest Author James Spiteri, Principal Product Marketing Manager @ Elastic
Security analytics is a search problem. Whether that means manually searching through security logs and events, scheduled queries to look for potentially malicious behaviour, or even modelling events to spot anomalous patterns in data - it all boils down to search.
At Elastic, we ‘re on a mission to arm every security analyst to succeed. In order to be able to do that, we had to start on a strong foundation of search. As the creators of the Elastic Stack, search is indeed at the heart of everything we do, and this led us to create a free and open security solution for everyone, built on top of the most popular engine used for search today.
Elastic Security combines security analytics (commonly known as SIEM - Security Information and Event Management) and endpoint security, providing a simplified experience for the end user. We began this journey as a unified platform in July 2020, with the release of the Elastic stack version 7.9, and we were only just getting started. With every minor release since then, we’ve added more features, more detection rules, and more data sources to help security teams protect the world's data from attack.
This blog post will highlight the core features of Elastic security, which is freely available to try on Elasticsearch Service. If you prefer, you can also download the different components of the stack and run them in your own environments.
Bringing Data In - Elastic Agent + Elastic Endpoint Security (Beta)
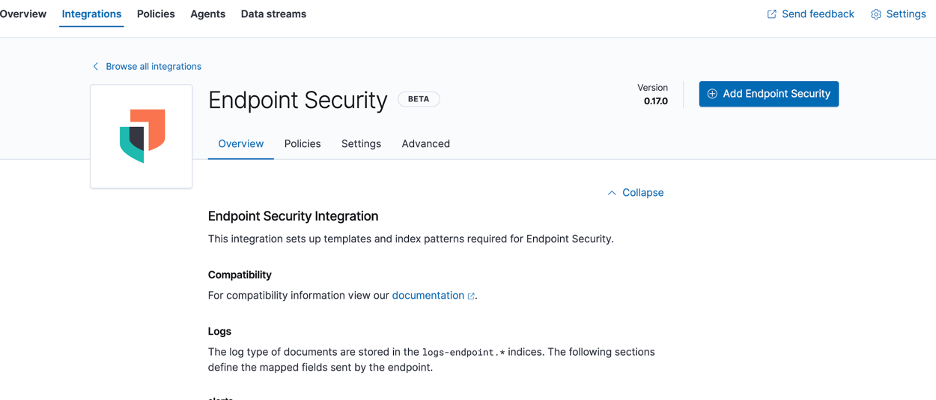
Elastic security can utilise any data source which adheres to the Elastic Common Schema, whether that’s using traditional tools built and maintained by Elastic (such as Beats and Logstash), or using 3rd party ingestion sources. To further simplify the experience, we’ve introduced Elastic Agent, which allows teams to manage policies and binaries right from the Security user interface. Prebuilt integrations make data ingestion easy by simply selecting the required data source from a streamlined user interface. Endpoint security is just another integration. Turn it on, configure your policy and you’re good to go!
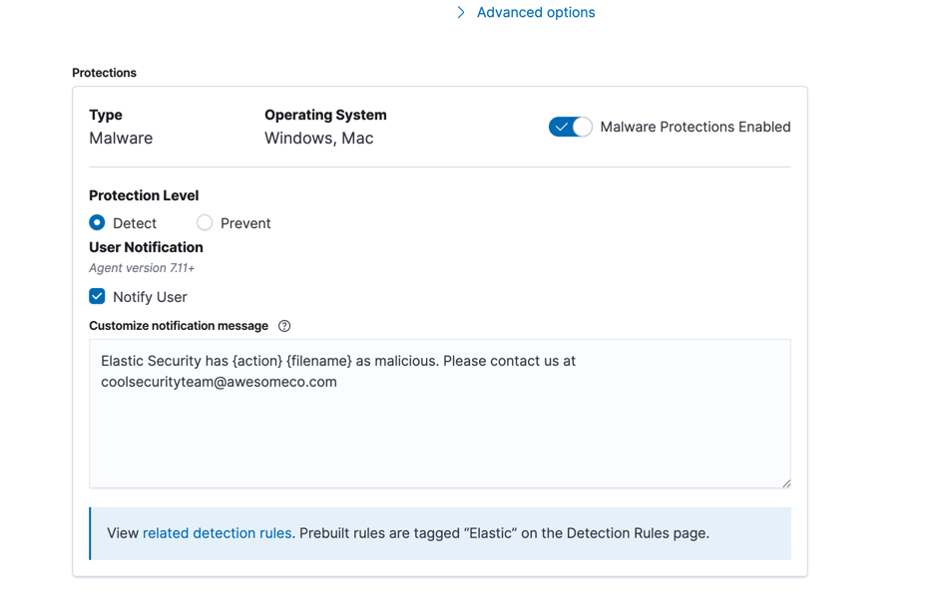
File-Based Malware Prevention
Apart from rich, kernel level security events, Elastic endpoint security allows you to prevent or detect file-based malware. This uses a signatureless technology known as Malwarescore, which uses a statistical machine learning model to identify file features on Windows and macOS which resemble malware. You can find Elastic’s Malwarescore on VirusTotal as an available engine.
Detecting potentially malicious activity - The Detection Engine
Apart from malware protection on endpoint devices, Elastic security also comes with a detection engine, with hundreds of prebuilt detection rules developed in the open. These detection rules cover various different technologies and attack types. Wherever possible, any detection rule we provide is also mapped to the MITRE ATT&CK framework, as well as investigation guides, which help analysts start their investigations on the right foot, as part of the rule metadata, all in the same place.
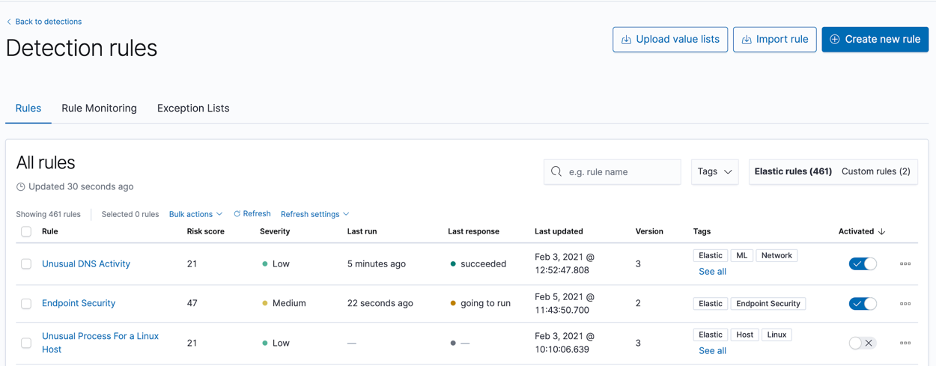
Apart from using Elastic’s built-in detection rules, users do, of course, have the ability to create their own detection rules, either via the user interface, or via the detections API. To simplify the latter, we also provide various test scripts and CLI tools for those teams looking to implement a “detections-as-code” strategy.
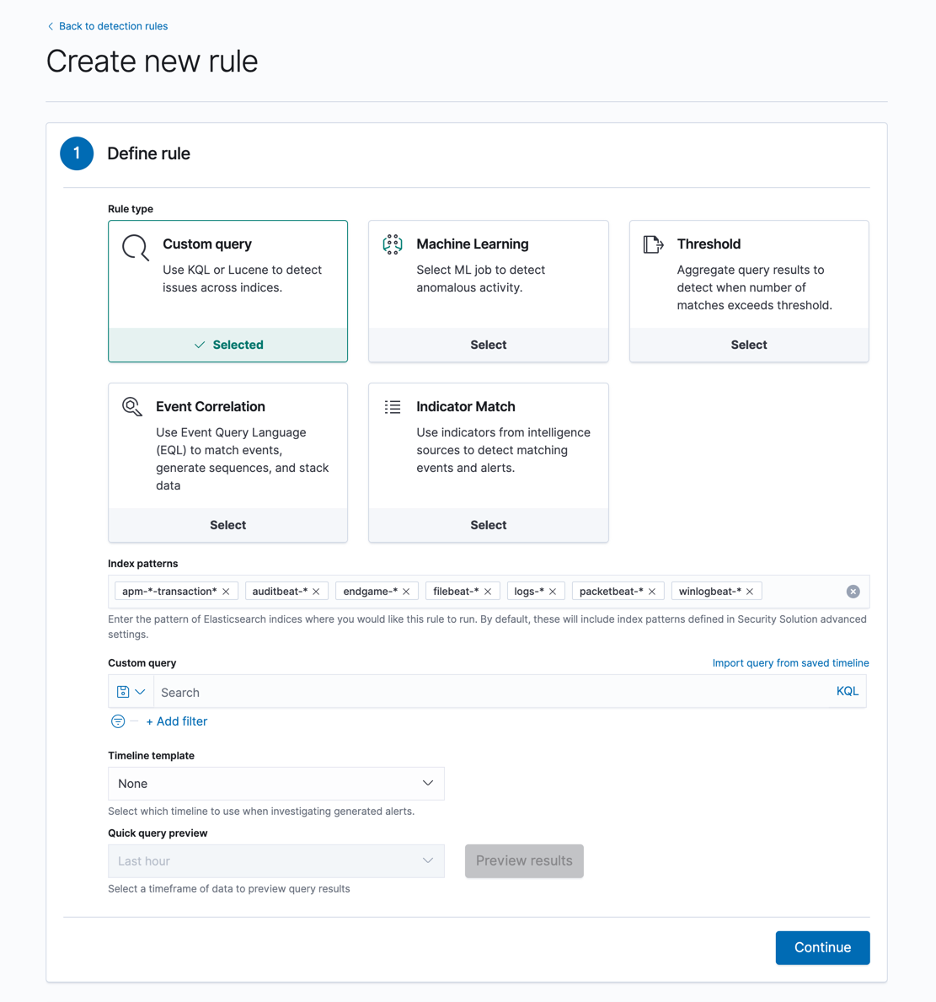
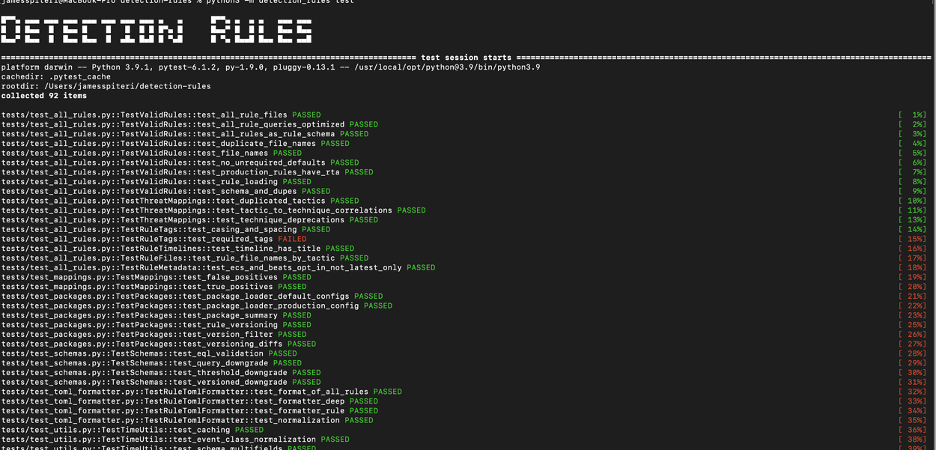
When creating rules, users also have various different options - depending on the type of rules they are looking to create.
One of the most anticipated and powerful features the detection engine offers is the ability to correlate across different data sources, and identify sequences of events by certain entities in their data. We introduced EQL - the Event Query Language - to allow users of Elastic Security to create these types of rules with ease.
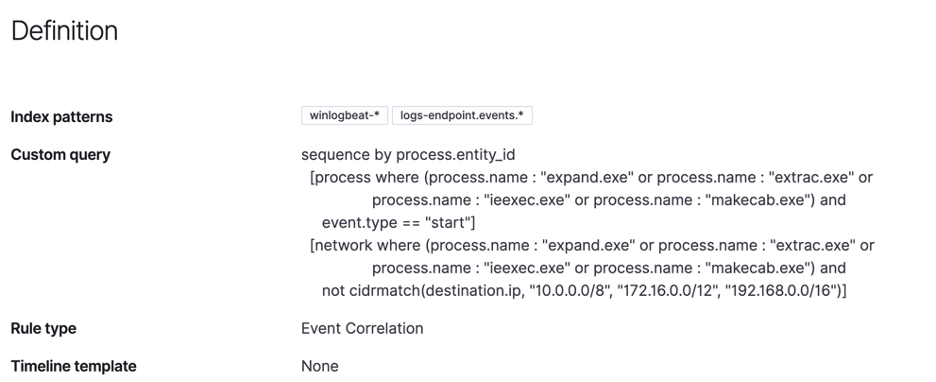
Users also have the choice to create Machine Learning-based rules, as well as Indicator match rules for any threat intelligence-based detections. There are also options to create rules based on thresholds, and the more traditional Kibana Query Language.
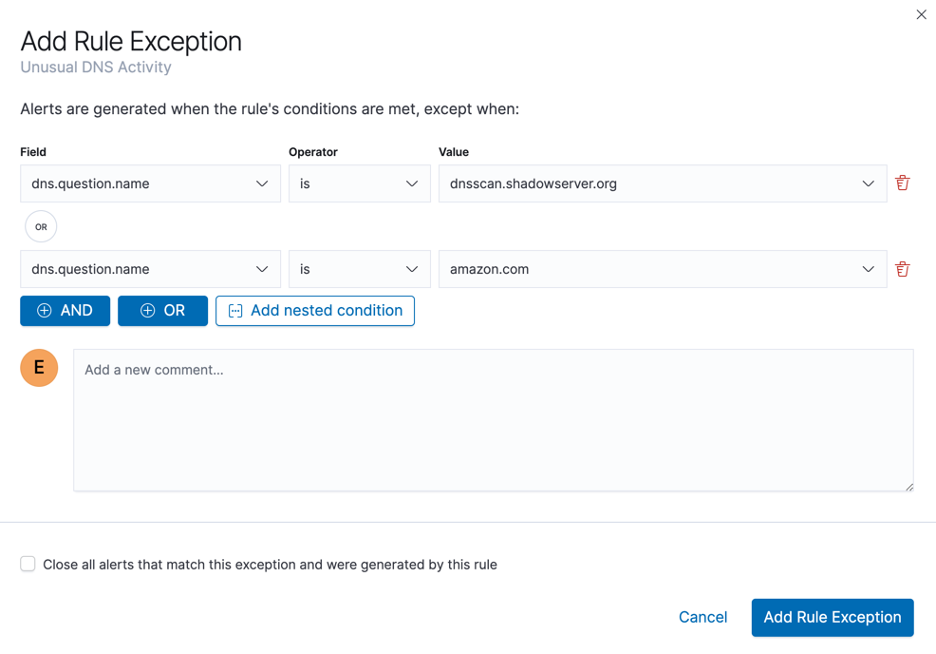
Detection rules also have an excellent workflow for handling false positives. Users can add exceptions to prebuilt or custom rules on demand, with a shortcut to do so from the detections page. We also support conditional logic for exceptions.
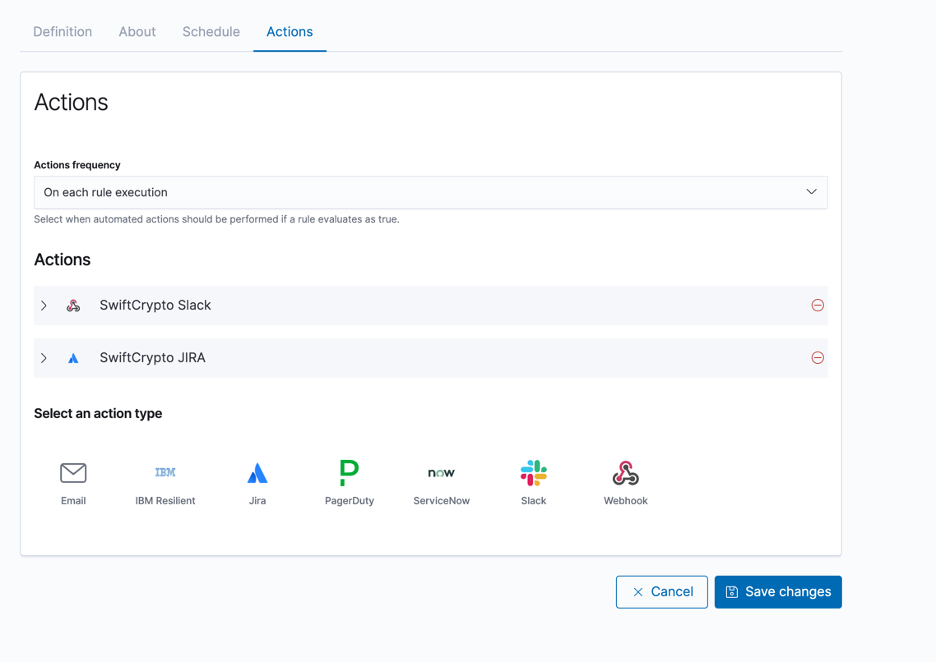
Lastly, users can choose to send alerts to 3rd party systems from the detection engine if they wish. This is available for any detection rule, and allows teams to get instant notifications on several different platforms.
Threat Hunting and Investigations with Event Analyser, Timeline and Timeline Templates.
Elastic security also offers a few different ways to hunt for threats, or carry out investigations after the detection engine triggers for any defined rules.
The timeline offers users an interactive way of creating queries by simply “dragging and dropping” elements into the query builder. It also offers users of Elastic Security the ability to add notes to individual events for follow up, evidence, guides, and more.
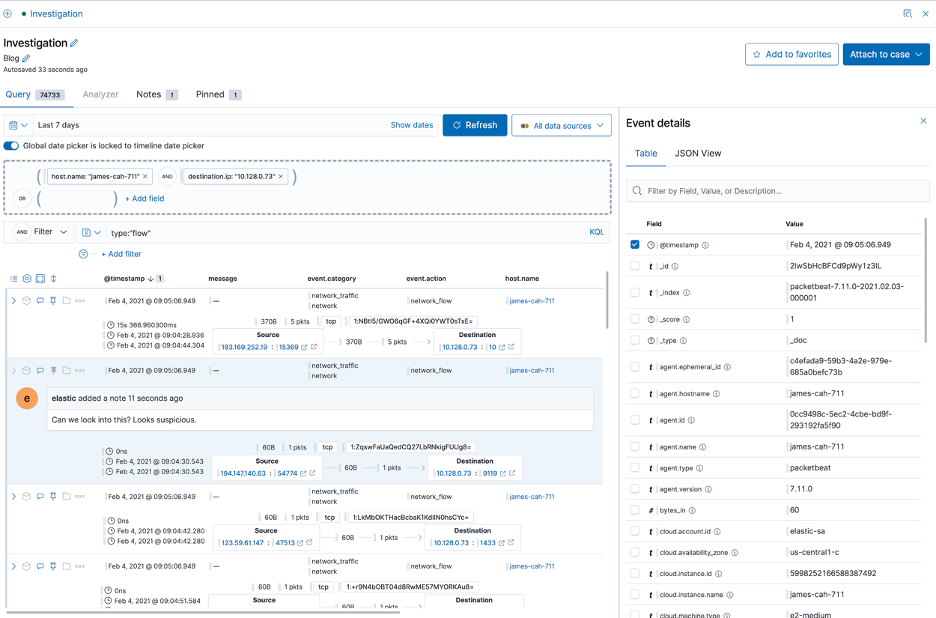
As part of the timeline ecosystem, users can also set up templates for quick and easy investigations based off of triggered detections. This means that once a dynamic template is defined, users will have a query automatically populated by the template, reducing an analyst’s MTTR.

If teams use the Elastic agent with endpoint security or the windows integration, they also have the option to use the graphical event analyser. This will display a view showing the parent and child processes belonging to the analysed event, as well as any other collected events for the processes in view. It is an incredibly powerful way to visualise events, as it allows an analyst to get an immediate “birds eye” view of everything that surrounded a specific event, as it happened. It is also interactive, meaning an analyst can click on different elements in the view to get more details.
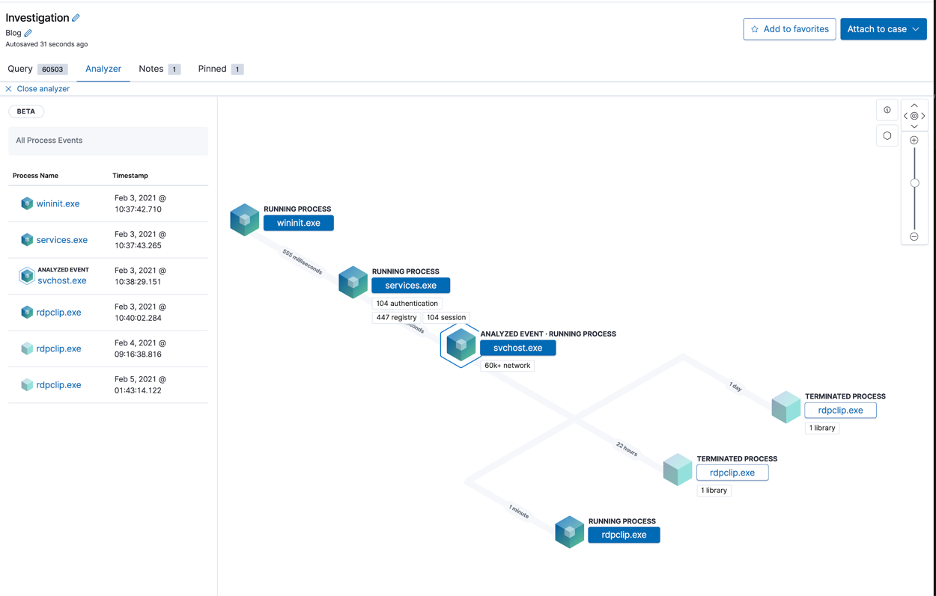
Timelines and templates can be saved and referenced at any time. They can also be exported and imported for sharing between teams and organisations.
Closing the loop - Case management
A typical workflow for security operations teams is to utilise some form of case management or ticketing tools to keep track of ongoing incidents.
Elastic Security has case management built right in. As an analyst is working in a timeline, or following up from a triggered detection rule, they can utilise cases to keep track of their progress, or even involve other team members as necessary. Case comments, like many other components in Elastic Security, support markdown syntax. This allows analysts to provide highly formatted responses to cases, as well as include elements such as linked images, bulleted lists, links, and more - with a quick link to include any existing timeline to a case.
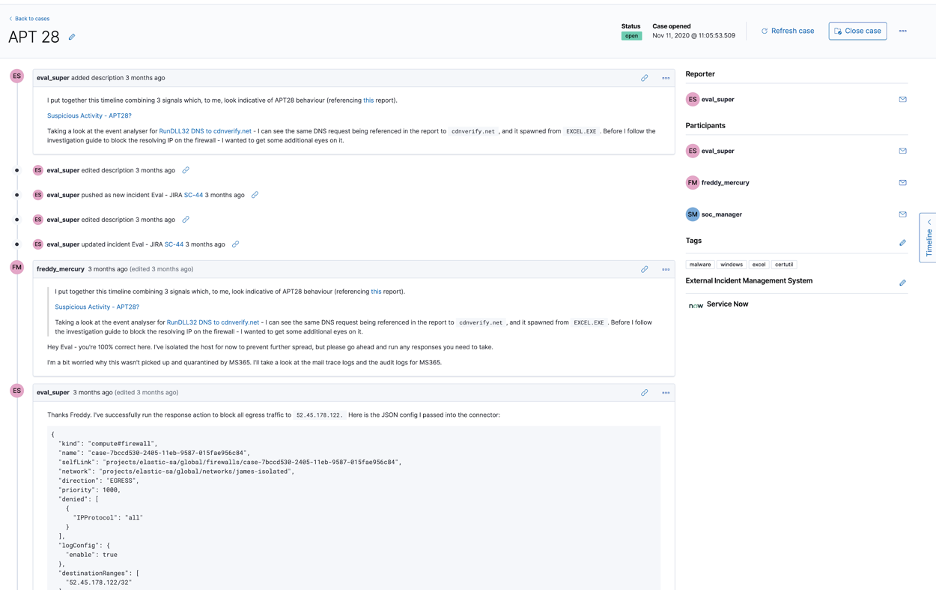
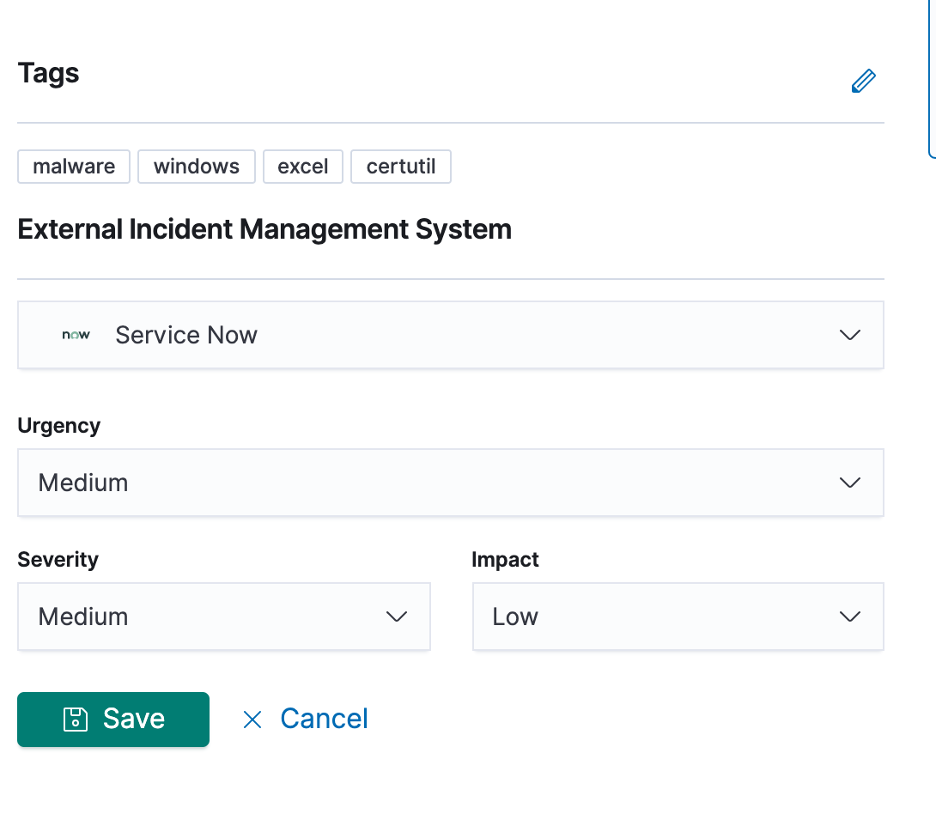
Cases also provides teams with the ability to seamlessly integrate with existing 3rd party ticketing systems such as Service Now, Atlassian JIRA and IBM Resilient. Should a user wish to do this, Cases will keep track of the status of the existing case in the 3rd party system, and inform users if they are out of sync. This provides teams with the best of both worlds if they already have ticketing systems in place.
Hopefully, this blog post has given you a sense of how Elastic Security can help teams detect and respond to security events. With our rapid software release cycle, you can expect to see additional features with each and every release.
Please feel free to contribute to our detections repository, join our community Slack workspace, ask questions, and provide feedback.


